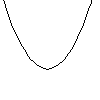
 $f(x) = x^2$
where $x$ goes from left to right and $f(x)$ goes from top to bottom. We sometimes write this as $f:\mathbb R\to \mathbb R, f:x\to x^2$.
We can generise this in two ways. You can have functions of two variables, such as $f(x,y)=x^2-y^2$.
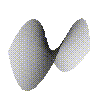 $f(x,y)=x^2-y^2$
big picture (13K)
3D model (10K).
$x$ runs from left to right, $y$ runs from front to back and $f(x,y)$ goes from bottom to top. We sometimes write this as $f:\mathbb R^2\to\mathbb R, f:(x,y)\to x^2-y^2$. You can get functions of one, two, three or any number of variables.
We can also generise functions to form maps, for example $f(x)=(x^2,x^3)$
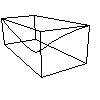 $f(x)=(x^2,x^3)$
big picture (3K)
3D model (2K).
Here we have added a box around the curve to help visulise it. $x$ runs from right to left and if we set $(y,z)=f(x)=(x^2,x^3)$ then $y$ runs from bottom to top and $z$ runs from from to back. For maps we often just draw the $y$ and $z$ values and omit the variable $x$. For example the image of this map (ie. the $y$ and $z$) is just
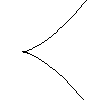 Image of $f(x)=(x^2,x^3)$
where $y$ runs from left to right and $z$ runs from top to bottom. If you rotate the 3D model so that you look along the $x$-axis you should be able to see this curve. Such images are sometimes called parametrised curves in the plane, $x$ is the parameter and $y$ and $z$ define a plane.
You can also get parametrised curves in three dimensions, for example $f(t)=(t^2,t^3,t^4)$, Here $t$ is the parameter,
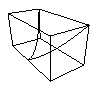 image of $f(t)=(t^2,t^3,t^4)$
big picture (3K)
3D model (2K).
again we have draw a box surronding the curve to help give a 3D feel.
We can combine the two generisations to produce mappings which depend on more than one variable. For example $f(x,y)=(x,x y,y^3)$
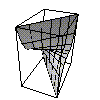 image of $f(x,y)=(x,x y,y^3)$
big picture (10K)
3D model (3K).
This is an example of a parametrised surface, in other words a map from $\mathbb R^2$ to $\mathbb R^3$. You can get maps from spaces of any number of dimensions into spaces of any number of dimensions.
The normal non-mathematical maps you get in an atlas, can be though of as mathematical maps from $\mathbb R^2$ (i.e. a bit of the earth) into $\mathbb R^2$ (i.e. a piece of paper). Mathematicians have borrow the term map and generilised it to help describe some quite abstract concepts.
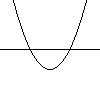 $f(x)=x^2-1$
here we have draw the curve $y=f(x)$ as well as the line $y=0$. The two points where the curve crosses the line are the zeros of $f$. We find that $x=-1$ and $x=1$ give us our two points. Sometimes we write $f^{-1}(0)$ to denote the zero set of the function $f$.
Of course we can generalise the notion of zeros to functions of more than one variable (mathematicians just love to generalise). Consider the function of two variables $f(x,y)=x^2-y^2$,
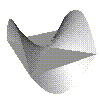 $f(x,y)=x^2-y^2$
big picture (13K)
3D model (9K).
Again we draw the surface and the plane $z=0$. When the surface crosses the plane we have a zero of the function. If we just look in the source (i.e. the $x-y$ plane) we see that the zeros just form two straight lines.
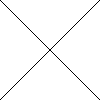 zeros of $f(x)=x^2-y^2$
Such a curve is called an implicit curve or algebraic curve.
Indeed we can also think of the zeros of a function of three variables, for examples $f(x,y,z)=x^2-y^2-z^2$
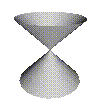 zeros of $f(x,y,z)=x^2-y^2-z^2$
big picture (13K)
3D model (8K).
Note we have just drawn the zero set in the $x$-$y$-$z$ space (its a bit tricky to draw $x, y, z$ and $f(x,y,z)$ all at the same time!). Such surface are called implicit surfaces or algebraic surfaces.
We can also thing of the zero sets of mappings. We won't be looking at any of these so I'll spare you the details.
To add to the confusion we are also likely to see curves and surfaces defined interms of graphs of functions like $z=x^2-y^2$. These are what you normally see in maths classes, one of the cordinates is defined in terms of the other cordinates. If we just thought this as $f(x,y)=x^2+y^2$ we would get a parametrised surface in one dimension. And the zeros of this function give is a implicit curve in the plane. The confusion arises because we are mixing up our variables, if we write $f:\mathbb R^2\to\mathbb R$ then if we draw both the variables in the source (i.e. $\mathbb R^2$) and the result in the target (i.e. $\mathbb R$), we get a normal surface in three dimensions. Here we'll typically only draw either the source or the target of the map. (Confused? I know I am).
One redeaming feature of graphs of functions is that they can easilly be converted into either parametrised or implicit representations. For example $z=x^2-y^2$ is the parametrised surface $f(x,y)=(x,y,x^2-y^2)$ and also the implicit surface $g(x,y,z)=z-x^2-y^2=0$.